
Introduction

Project Goals and Research Questions
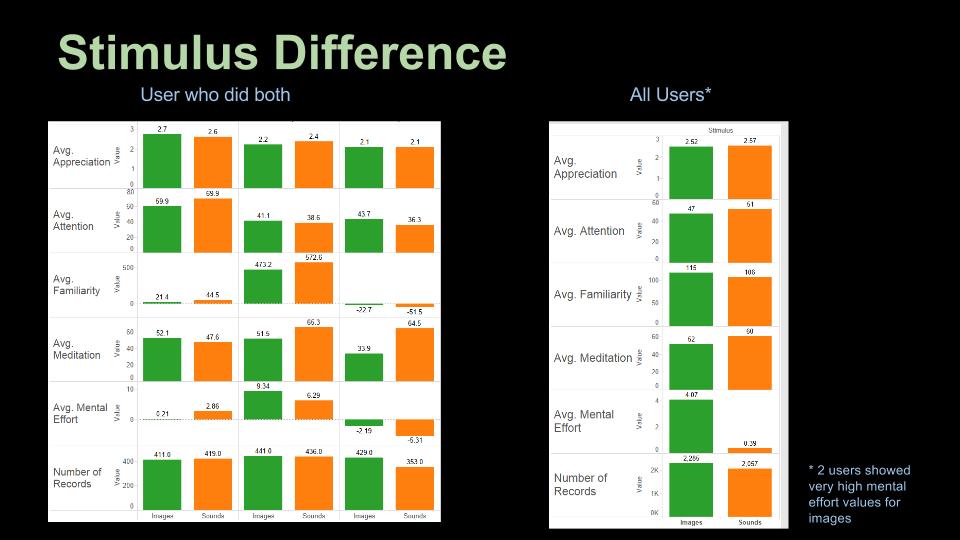
We used the IAPS[1] and IADS[2] dataset to compare the patterns in brain waves in response to visual and aural stimuli. The key question we had was whether users’ emotional response to a certain stimulus differs based on the medium of that stimulus (in this case images v/s. sounds). For consistency, we used 25 files from IADS and 25 files from IADP that correlated to the same theme for testing.
Potential Applications
Targeted Advertising: focus on showing images that can solicit the desired behavior from the user based on their history. The same goes for stimulus selection. If a user is known to respond better to sounds than images, then advertisments should have a strong sound element. Sound or image can be emphasized or de-emphasized and the content can be made more adaptive to user’s responses without any direct feedback. Standardized Tests: By understanding users EEG patterns, standardized psychological and personality tests could be improved by reducing the likelihood of a user lying to fool the test. Education: If one type of stimulus is proven to be better than the other in eliciting certain types of responses (e.g attention, appreciation, etc.), classroom instruction methods can be redesigned or diversified to exploit these results for more effective teaching. Cinema/Filmmaking/Media: The results can better inform filmmakers about which elements of stimulus might be more effective in which contexts in cinematography. Marketing/Advertising: By identifying which type of medium accrues the greater brainwave data, there can be an understanding of which medium to use for marketing purposes to capture the audience’s attention. Comparing the peaks for each medium, it can help determine which will allow for optimal interest and focus.
Interviews and Ideation Plan
We built a user interface which displays images and plays sounds for the subject to rate them in one of the three categories - Like, Dislike and Neutral. We customized the interview methodology used in the IAPS and IADS studies which was a paper based version and asked users to rate the images and sound in a booklet. They closely follow the Self-assessment Manikin(SAM, Lang 1980) methodology. Parameters such as time the image/sound is provided to user are to be determined.
Components
Dataset:
The IAPS and IADS datasets are standardized and have been used in research extensively. We aim to use subsets of each dataset that are equivalent to each other. The images and sounds used in each experiment will be selected carefully. We aim to use more extreme images along the emotional dimension the dataset has. Our plan is get image that are likely to illicit highly positive or highly negative emotion. Neutral images help control for both responses. This will , hopefully, reduce dimensionality of user responses and improve chances of predicting those responses. We customized the interview methodology used in the IAPS and IADS studies which was a paper based version and asked users to rate the images and sound in a booklet. They closely follow the Self-assessment Manikin(SAM, Lang 1980) methodology. Parameters such as time the image/sound is provided to user are to be determined. Instead of using papers, we built a user interface which displays images and plays sounds for the subject to rate them in one of the three categories - Like, Dislike and Neutral.
Hardware:
Mindwave: We will be using the Mindwave device to capture brainwave data HR Sensor: To capture heart rate data. This was planned but we could not find a HR sensor that gives out the data per second. Devices available provided readings based on minutes.
Software:
Python/Web: We are using a python web app (with flask) to conduct the experiments, analyze the data, and visualize the conclusions. This architecture allows us to combine both UI elements with backend data processing. Also, because timing is critical, we need to ensure we time user response accurately to synchronize them with data inputs from the sensors. Using python also allows us to use the mindwave sensor in real time if possible. We have extended the indra-client module to allows us (and anyone else) to run it in parallel with our application. One downside to this is that we won’t be able to use NeuroSky metrics which need to be post-calculated.
Scikit-Learn: Python library for machine learning
NeuroSky Apps: to capture and calculate mindwave data and metrics
Tableau: Tableau for visual analysis of the data.
Implementation
Approach
Build the technical backend to conduct the experiment and capture user responses. Conduct several experiments informally within the I School friends and family network to capture bio data and responses. Prepare bio data for analysis * calculate mindwave metrics and load them to the database
- upload heart rate data to the database Analyze the different data streams to:
- compare stimulus responses for each user
- build the prediction classifier
- build information visualizations to simulate the experiment Conduct additional interviews with the full system to verify the findings. Brief follow up about the experience of the experiment.
Image Selection:
IAPS and IADS datasets use three metrics - Pleasure, Arousal and Dominance which are based on the Self-Assessment Manikin (SAM) methodology. We used these three metrics to find the extreme images or sounds for the experiment. We sampled the files which were +/- 1.5 or 2 standard deviations away from mean. We manually looked at the files as well to ensure that the content is extreme. To pick up neutral stimuli, we sampled files around the sample. We build scatter plots for the combination of pleasure, arousal and dominance to find the right set of files. We repeated this process for finding a set for males and females for each stimuli - image and sound. In all, 4 sets were created and used in experiments.
Experiment App
We built the Mind-Heart-Reader app and backend database to display and capture user images
- Process:
- Create user-> create experiment with specific image/sound set -> connect sensors -> conduct -> upload sensor data.
- Initially, we had a 20 second time window per file. We found that users were bored and anxious to proceed so we reduced it to 15 seconds but with 25 image. One hypothesis is that the data that matters is in the beginning of each window (i.e. the first impression).
- We had issues mapping the times of user responses with mindwave data because of different timezone settings so we had to fix that programmatically.
- We deployed the app on Amazon Web Services to allow all members access to it. However, the images/sounds were stored on a our secure iSchool server and accessed remotely from AWS.
Experiments
- Conducted several (10 complete) experiments
- 4 participants did both sound and image experiments
- Conducted several failed experiments:
- Sensors didn’t connect
- NeuroSky platform didn’t start or crashed
- Unable to obtain good quality signal before or during the experiment
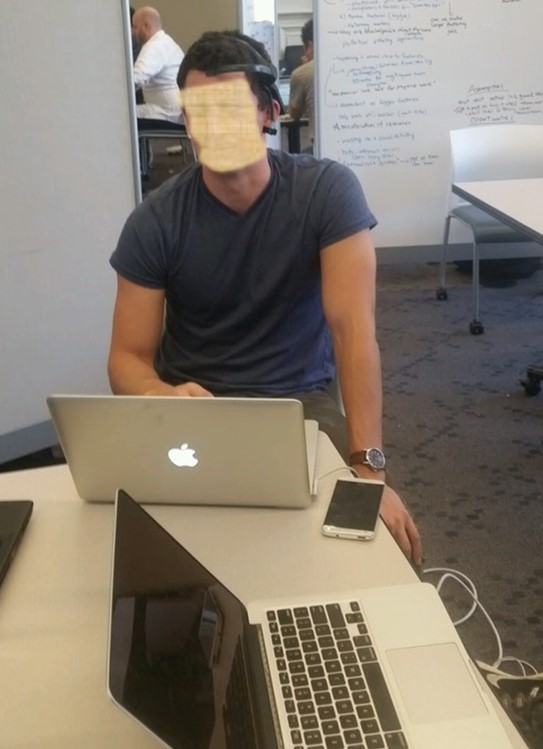
- Changed experiment setup to be on two machines instead of one:
-
managing the sensor platform and the experiment application was too distracting and confusing to the users. We prepared a dedicated laptop for the sensors and conducted experiment using isolated desktops in the co lab. This was also better ergonomically for the participants.
Experiment Demo
Demo can be found at:
The demo shows the process of initiating the sign up process for the experiment and the user completing the experiment with the IAPS data set.
Because users were unfamiliar with the device, we were there to help setup the Mindwave instrument on them:
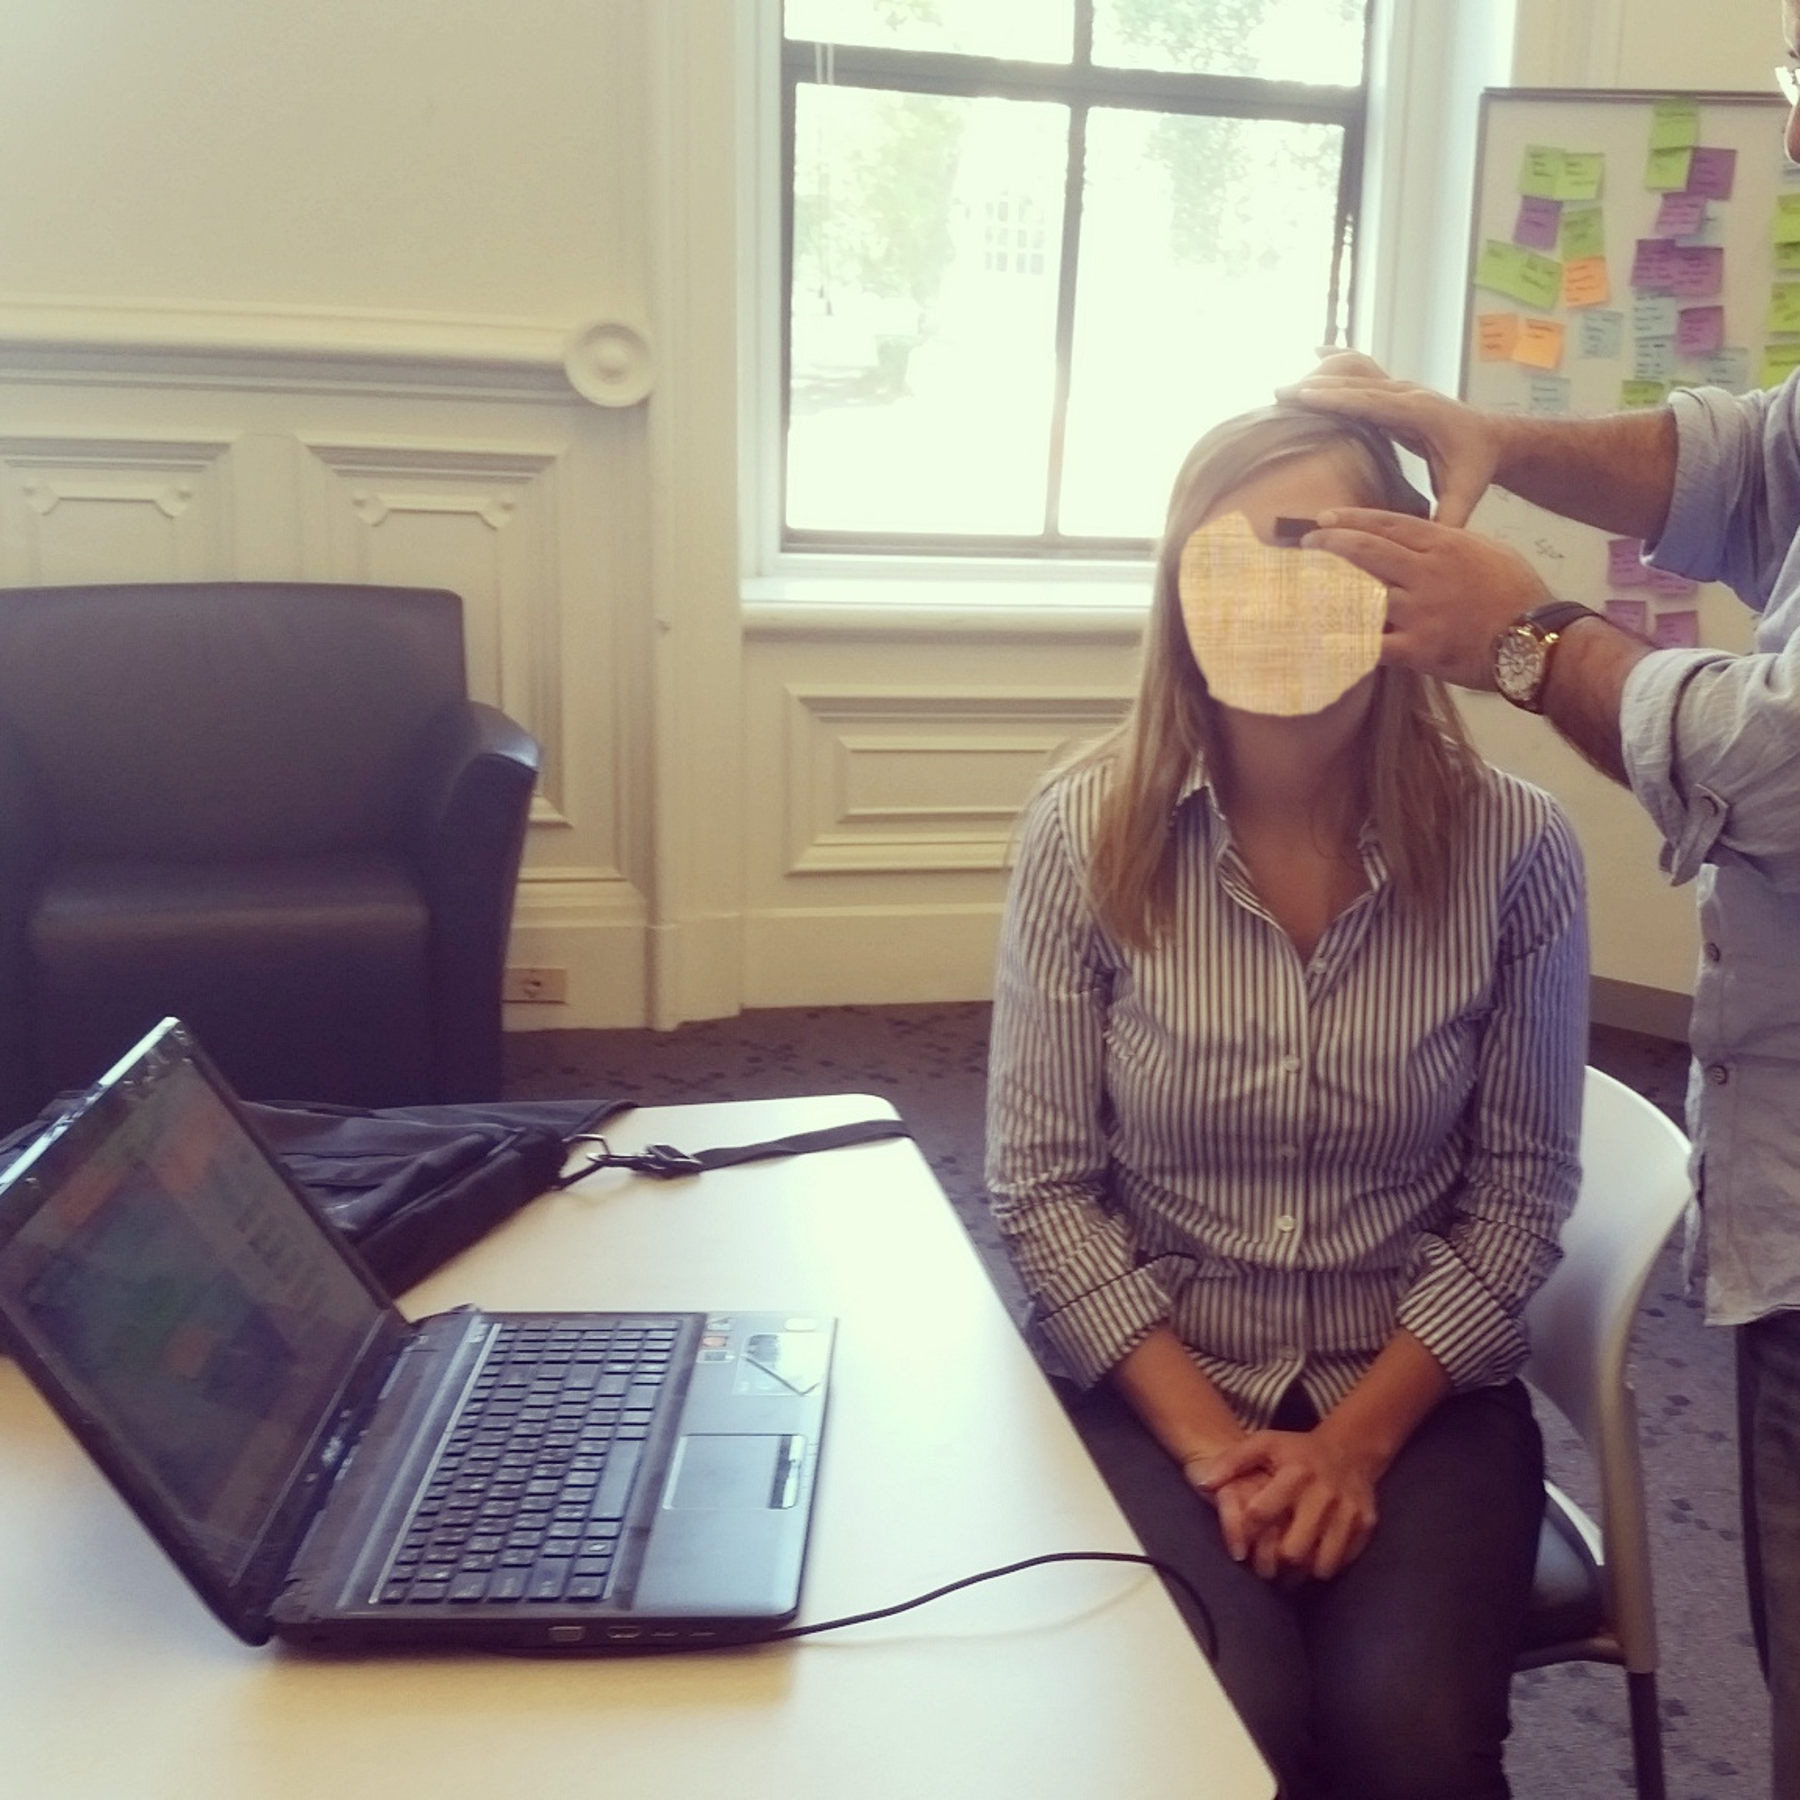
Users were shown images and given the option to Like, Dislike, or Neutral about how they felt about the image.
Reactions varied based on what the user encountered:
Visualization
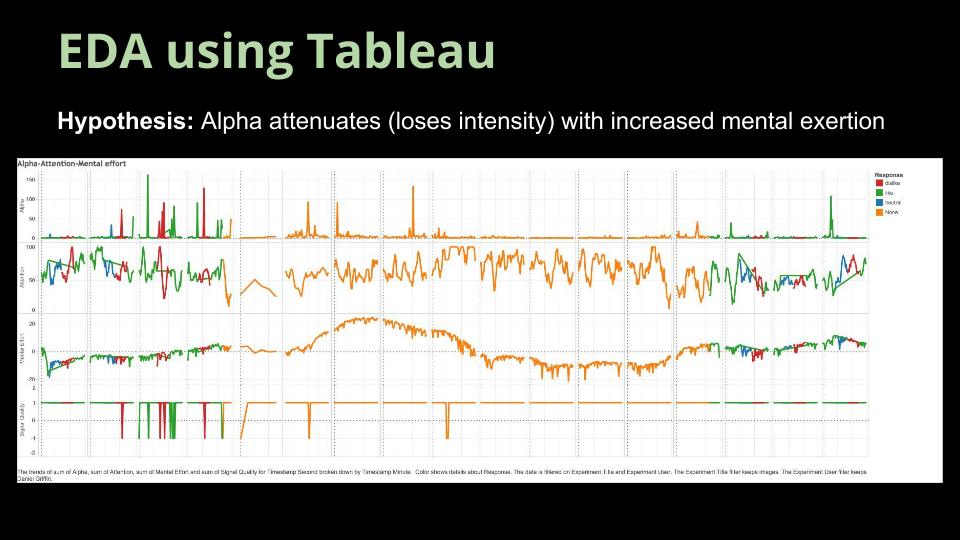
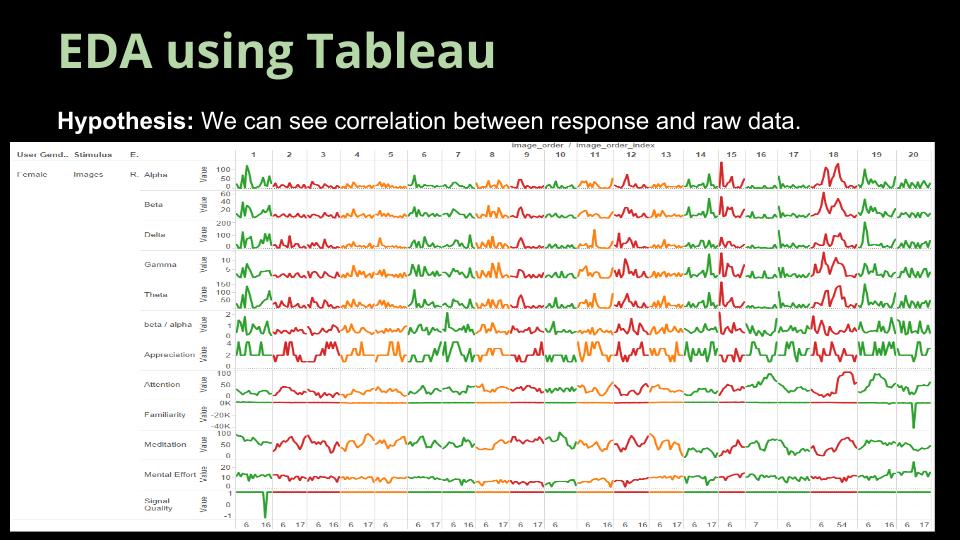
- Initial plan was to build custom visualizations with D3 into the app. However, when we explored the data from early experiments visually using Tableau, we didn’t find any clear patterns. We decided to focus our time and effort doing visual analysis using Tableau instead of spending time on building custom visualization that might not show anything.
- We had to customize the database data dump to make it more suitable for visual analysis with Tableau.
Classification
- For this experiment, the three classification labels are - Like, Dislike and Neutral. We chose the scikit implementation of OneVsRestClassifier. It internally creates classifiers for each label and fits them against all other classifiers.
- We used the features - Alpha, Beta, Gamma, Theta, Delta, Appreciation, Familiarity, Subject ID, Mental Effort and Meditation.
- The accuracy was about ~32-36% which is as good as guessing given we have three classes. We didn’t use the raw data from Neurosky but used the processed output(assuming it will be more useful) for our analysis.
- We looked at the .mat file generated alongwith the CSV files generated by mind wave, but we couldn’t interpret what the data columns mean and what signal is being measured.
Evaluation
Analysis & Results
More Details in the presentation.
Raw data and Tableau analysis books are available on the repository under the analysis folder.
Challenges
- No HR sensor with reading/second
- Reliability of EEG sensor during experiments
- Understanding EEG signals
- Parsing raw EEG data from Matlab
- Isolating the effects of various confounding factors that can affect signal
- e.g. biases, surroundings, sensor position, signal quality, etc. Controlled environment There were times the users were distracted and so for future experiments, it will be done in a more closed setting Understanding of the device Participants were unfamiliar with the device which may have caused an impact to the readings given that they may have focused more on what they were wearing than the data. ## Next Steps
- Use EEG raw data to analyze and build power spectrums
- More experiments in better controlled environments Inform users ahead of time about the device being used so they can have a sense of familiarity and not be distracted by it
References
[1] Lang, P.J., Bradley, M.M., & Cuthbert, B.N. (2008). International affective picture system (IAPS): Affective ratings of pictures and instruction manual. Technical Report A-8. University of Florida, Gainesville, FL.
[2] Bradley, M. M., & Lang, P. J. (1999). International affective digitized sounds (IADS): Stimuli, instruction manual and affective ratings (Tech. Rep. No. B-2). Gainesville, FL: The Center for Research in Psychophysiology, University of Florida
[3] Tableau
[4] Scikit-learn: Machine Learning in Python, Pedregosa et al., JMLR 12, pp. 2825-2830, 2011.